With a positive we have:

Observations?
-the graph is a hyperbola with asymptotes at y=a and x=1
With a negative we have:
Observations?
-the graph is a hyperbola with asymptotes y=a and x=1 as before but the graph has inverted across the x axis
Final Assignment
Part 1
by
Allison McNeece
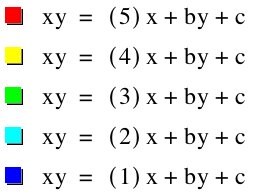
1. Consider the graphs of the equation: xy=ax+by+c for various substitutions of real number coefficients a,b, and c.
Give a comprehensive description of the families of curves, with illustrations, that result.
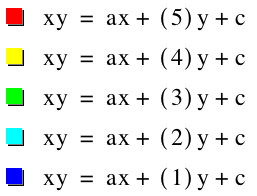
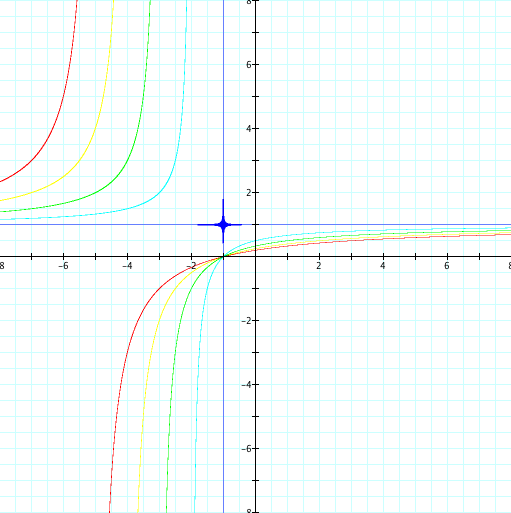
Let's start by varying the values for a while keeping b and c fixed at 1:
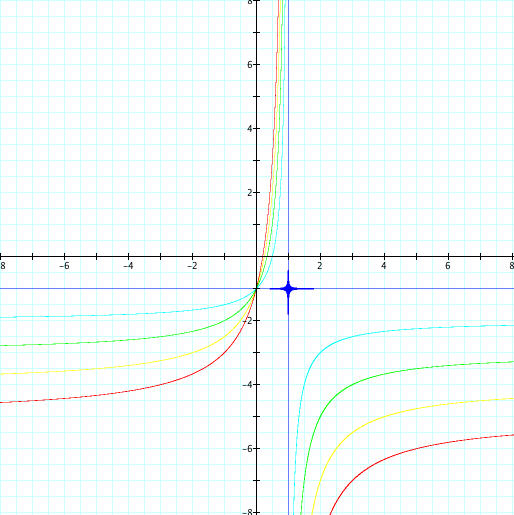
With a positive we have:
|
|
Observations? -the graph is a hyperbola with asymptotes at y=a and x=1 |
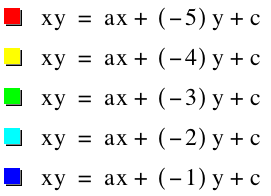
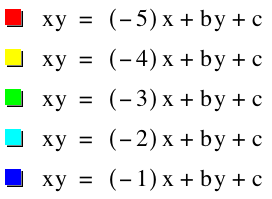
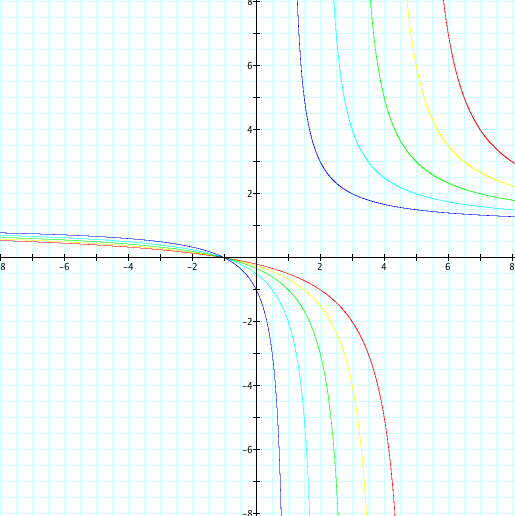
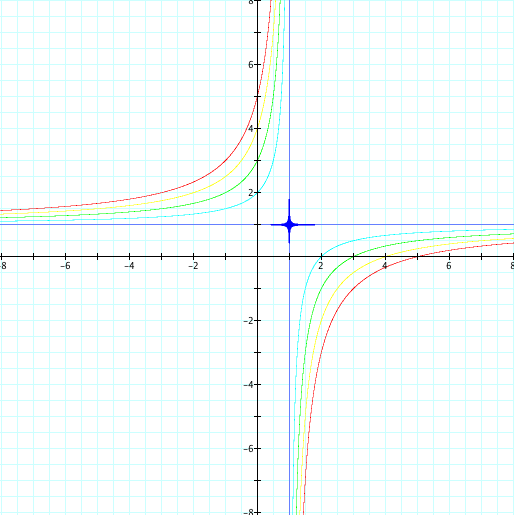
With a negative we have:
|
|
Observations? -the graph is a hyperbola with asymptotes y=a and x=1 as before but the graph has inverted across the x axis |
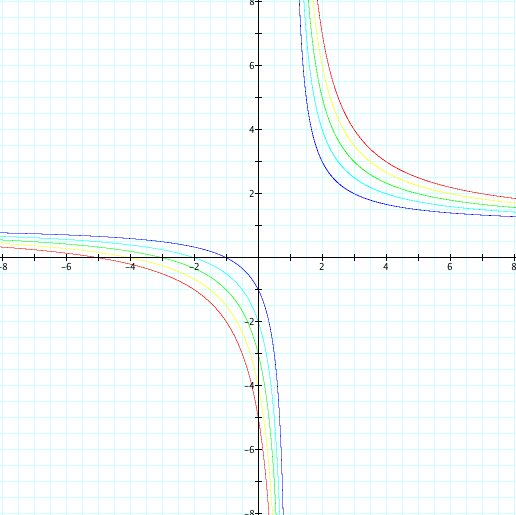
Now let's vary b but keep a and c fixed at 1:
With b positive:
|
 |
Observations: -again we have a hyperbola but the asymptotes are now at y=1 and x=b |
With b negative:
|
 |
Observations: -same graph as previous (for the values of b=-5,-4,-3,-2)with asymptotes at y=1 and x=b but inverted across the y axis. -note the graph of xy=ax-y+c. This ends up being just two straight lines. hmmmm..... |
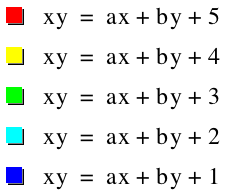
And lastly we vary c keeping a and b fixed at 1:
With c positive:
|
 |
Observations: -We again have a hyperbola. The asymptotes are at y=1, x=1 -How is c changing the graph? It seems that as |c| increases the vertex of the hyperbola move further away from the center of the hyperbola |
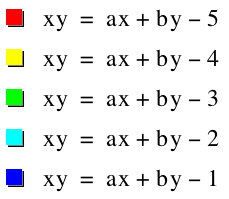
With c negative:
|
 |
Observations? -same as previous graph but when c=-1 we have two intersecting lines and the hyperbolas are inverted across the y axis |
What have we learned here?
The graph of xy=ax+by+c is a hyperbola with asymptotes of x=b and y=a
rewritten asymptotes are where (x-b)(y-a)=0
If we were to rewrite this equation we would have:
xy=xa+by-ab
hmm.. that looks a lot like our original equation: xy=ax+by+c
What does this tell us about the graph that we had above where a=1,b=1,c=-1?
What if we were to look at (x-b)(y-a)=k for any integer k?
Then we would have xy=xa+by-ab+k
So when we were looking at a=1 and b=1 with varying values for c we had this equations:
xy=x+y-1+c
Thus c=k.